What Is a Good Engagement Rate on Instagram?
When I'm asked what is a good engagement rate on Instagram, I start with account size and the calculation behind the number. A percentage without those details can send you toward the wrong content changes.
TB Tomas Brandt, Analytics writer · Updated Oct 6, 2026 · 6 min read
Short answer
A good Instagram engagement rate beats your size-group median: 2.6% at 1,000 to 10,000 followers, 1.2% at 10,000 to 50,000, 1.1% at 50,000 to 500,000, 0.7% at 500,000 to 1 million, and 0.6% above 1 million. These measure likes plus comments per post against followers.
What is a good engagement rate on Instagram by account size?
For creator images and carousels, the size-group medians range from 2.6% for accounts with 1,000 to 10,000 followers to 0.6% for accounts above 1 million. I'd call a comparable rate above your group's midpoint good, then look at whether those interactions support your account's purpose.
These reference points summarize 2025 creator content. They use likes plus comments relative to followers, which makes them useful for comparing public-facing performance. For a business account, add comparable brands in your niche to the comparison.
A median is the midpoint: half the measured results sit below it and half above it. It isn't a recommended minimum or an arithmetic average.
The published tiers start at 1,000 followers. Below that size, use your own recent trend rather than treating 2.6% as a measured benchmark for your group.
| Follower count | Median engagement rate |
|---|---|
| 1,000 to 10,000 | 2.6% |
| 10,000 to 50,000 | 1.2% |
| 50,000 to 500,000 | 1.1% |
| 500,000 to 1 million | 0.7% |
| More than 1 million | 0.6% |
How to calculate Instagram engagement rate for these benchmarks
Use this formula: engagement rate = average likes plus comments per post ÷ followers × 100.
The word average does important work. Adding a month's interactions and dividing by followers alone produces a period total, not the per-post rate used in the table.
I'd start with the most recent 12 eligible posts as a practical worksheet sample. Keep the selection rule consistent, and use publication dates rather than grid position so pinned posts don't quietly change what you're measuring.
Say you run a bicycle repair shop with 8,000 followers. Your selected 12 images and carousels earned 2,880 likes plus comments altogether. That's 240 per post. Divide 240 by 8,000 and multiply by 100: your rate is 3%, above the 2.6% reference for that follower tier.
The free Instagram engagement rate calculator gives you a quick calculation and comparison with these follower-count bands. Keep your worksheet too: it records which posts produced the number, so you can investigate what worked.
- Choose a recent sample of images and carousels using their publication dates.
- Record the number of posts, your follower count, and the dates covered.
- Total likes and comments, then divide by the number of posts.
How is your account doing?
Enter a username. The free scan reads your public numbers and compares them with accounts your size. No login.
Engagement rate by followers vs. reach: choose the right comparison
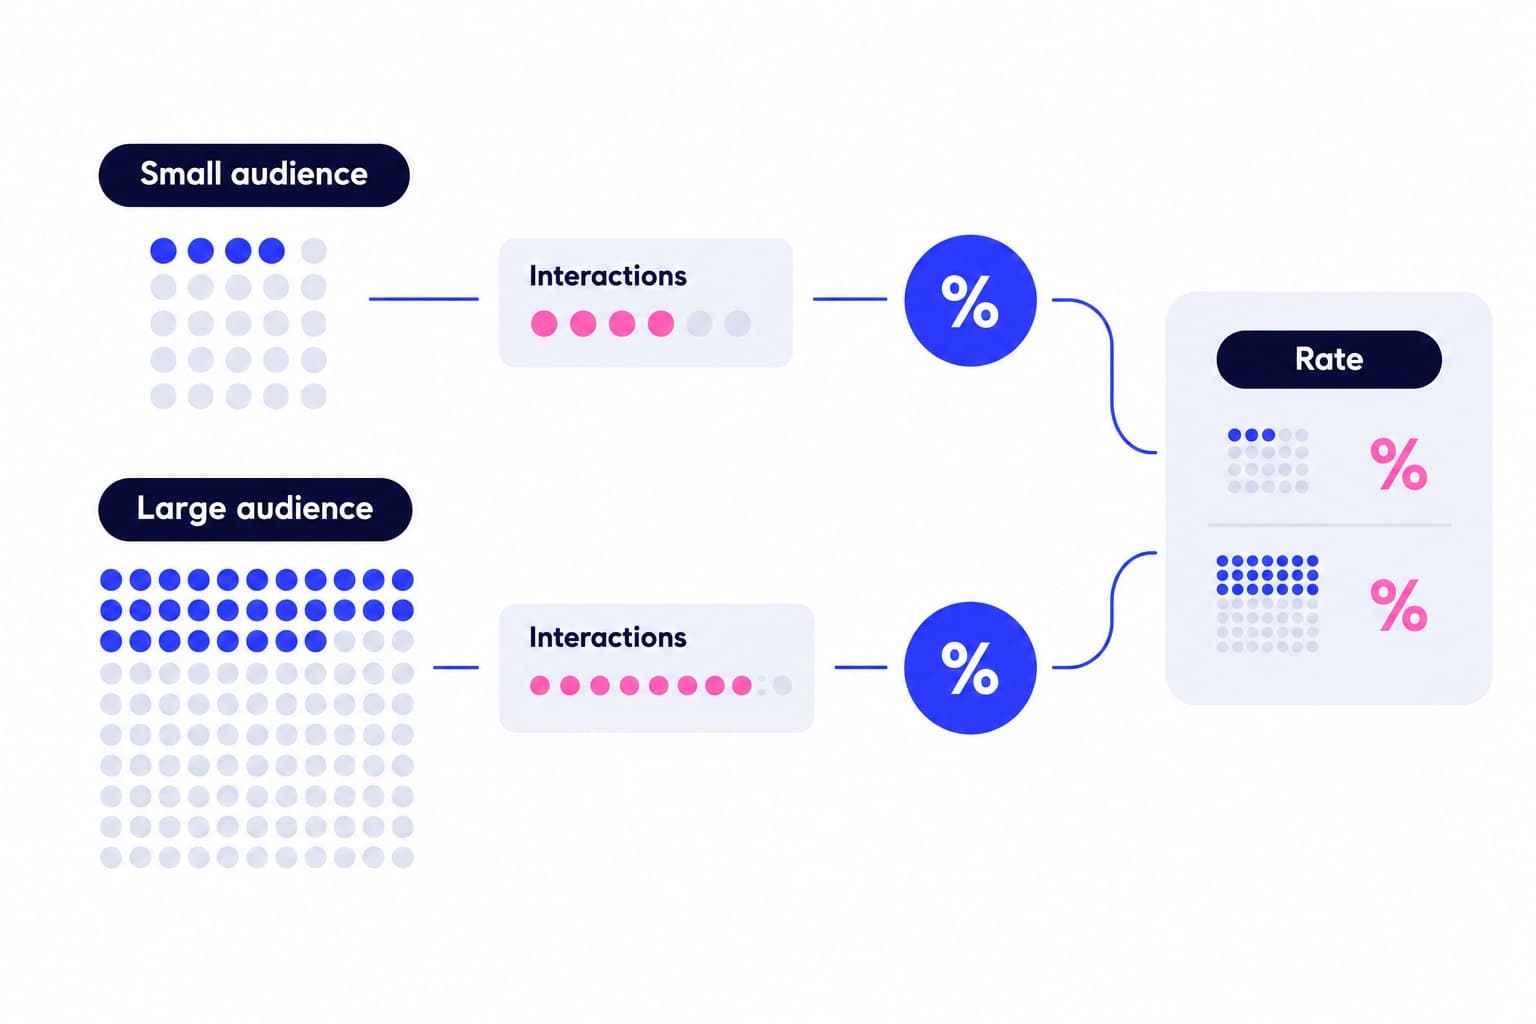
Instagram's Interactions metric includes likes, comments, saves, and shares. That's a broader numerator than the likes-plus-comments benchmark above.
For a repair shop like this, if one post earns 240 likes plus comments, 60 saves, and 30 shares, it has 330 interactions. Against 8,000 followers, the broader interaction rate is 4.125%. Against 2,000 unique viewers, it's 16.5%. The content hasn't changed; the calculation has.
Label your spreadsheet columns with the actions and denominator, not just ER. I'd use LC/followers for the benchmark column and interactions/viewers for the exposure column.
Interactions count actions, not distinct people. Someone who likes and saves a post contributes two actions. Accounts engaged is the separate metric for unique accounts that interacted.
For Reels, Views can include replays, while Viewers counts unique accounts. Keep video comparisons together, and read Average watch time and Follows beside the interaction rate. That combination shows both attention and the next action.
| Included actions | Denominator | Useful comparison |
|---|---|---|
| Likes plus comments | Followers | Creator tier comparison |
| All post interactions | Unique viewers | Response to exposure |
| Reel interactions | Video views | Video-to-video tracking |
Find the numbers in Instagram Insights
For an individual post, tap Profile or your profile picture in the bottom right, open the post, then tap View insights. Post insights are available for public personal and professional accounts.
Read Interactions and Profile activity separately. Interactions describes responses to the content; Profile activity describes actions people take when visiting your profile after engaging with the post.
For account trends on a business or creator account in the mobile app, open your profile and tap Insights. You can also access insights through your professional dashboard. Then set the reporting window:
Instagram supports account date ranges within the past 90 days. A 30-day window is a useful starting point for a monthly review, but record the actual dates rather than writing only 'last month.'
I'd also record how old each post was when you collected its counts. A post measured after one day and another measured after three weeks have had different amounts of time to collect responses. For a planned content test, collect each result at the same age, such as seven days after publication.
- On the Insights screen, tap the time frame drop-down in the top left.
- Select Last 30 days, then tap Update in the top right.
- Check that the displayed date range matches your worksheet.
How to increase Instagram engagement without guessing
I'd skip a generic 'Agree?' caption. It can collect responses, but it tells you little about what your audience needs. A useful question should give you material for the next post.
For a repair shop like this, replace a picture captioned 'We service bikes' with a carousel titled 'Three signs your brake pads need replacing.' Show the signs clearly, then ask, 'Which symptom have you noticed on your ride?' The topic, explanation, and question all serve the same person.
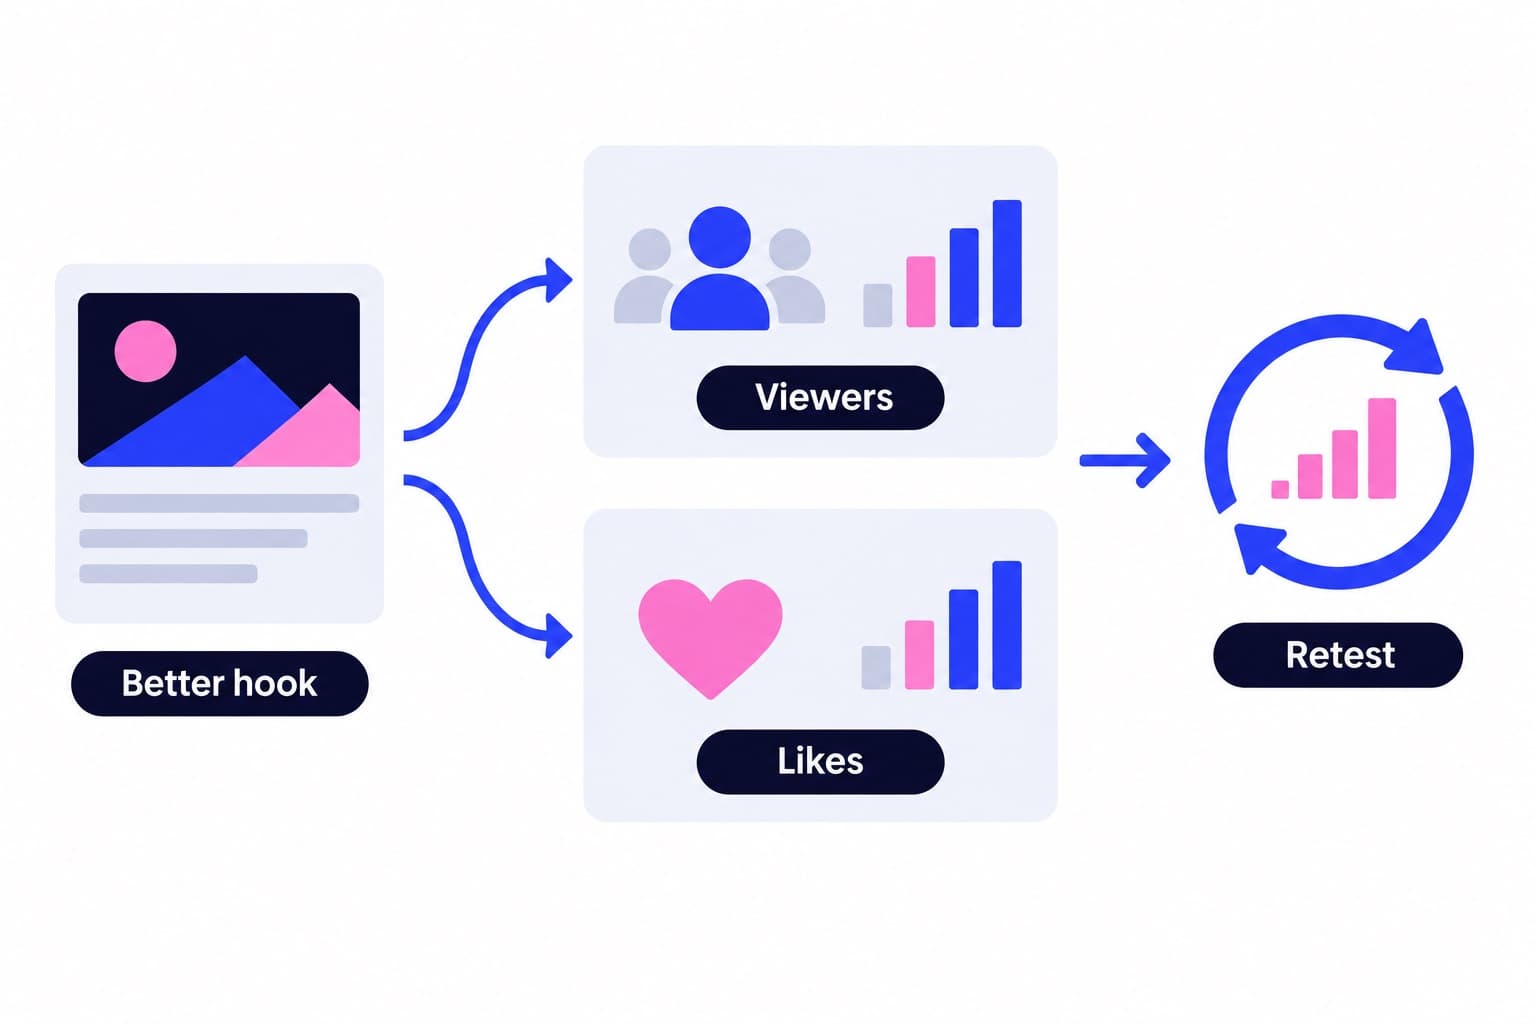
Choose one change for the next comparable posts rather than changing the topic, format, timing, and caption together:
Instagram lists followers' most active times in Total followers insights once you have at least 100 followers. I'd treat those times as test candidates and compare results at the same post age.
Keep saves and shares in their own columns even though they're outside the public benchmark. A practical repair guide might earn fewer likes but more saves than a finished-bike photo. Read Profile activity too if your business wants inquiries rather than reactions alone.
For a structured starting point, Ganicly's free profile scan compares your public profile's engagement with its follower tier. Use that reference to choose what to investigate before rewriting your entire content calendar.
- Opening image: replace a broad topic with a recognizable problem.
- Caption: ask one specific question tied to the post.
- Timing: test a publishing time suggested by follower activity.
Why your engagement percentage can fall while response grows
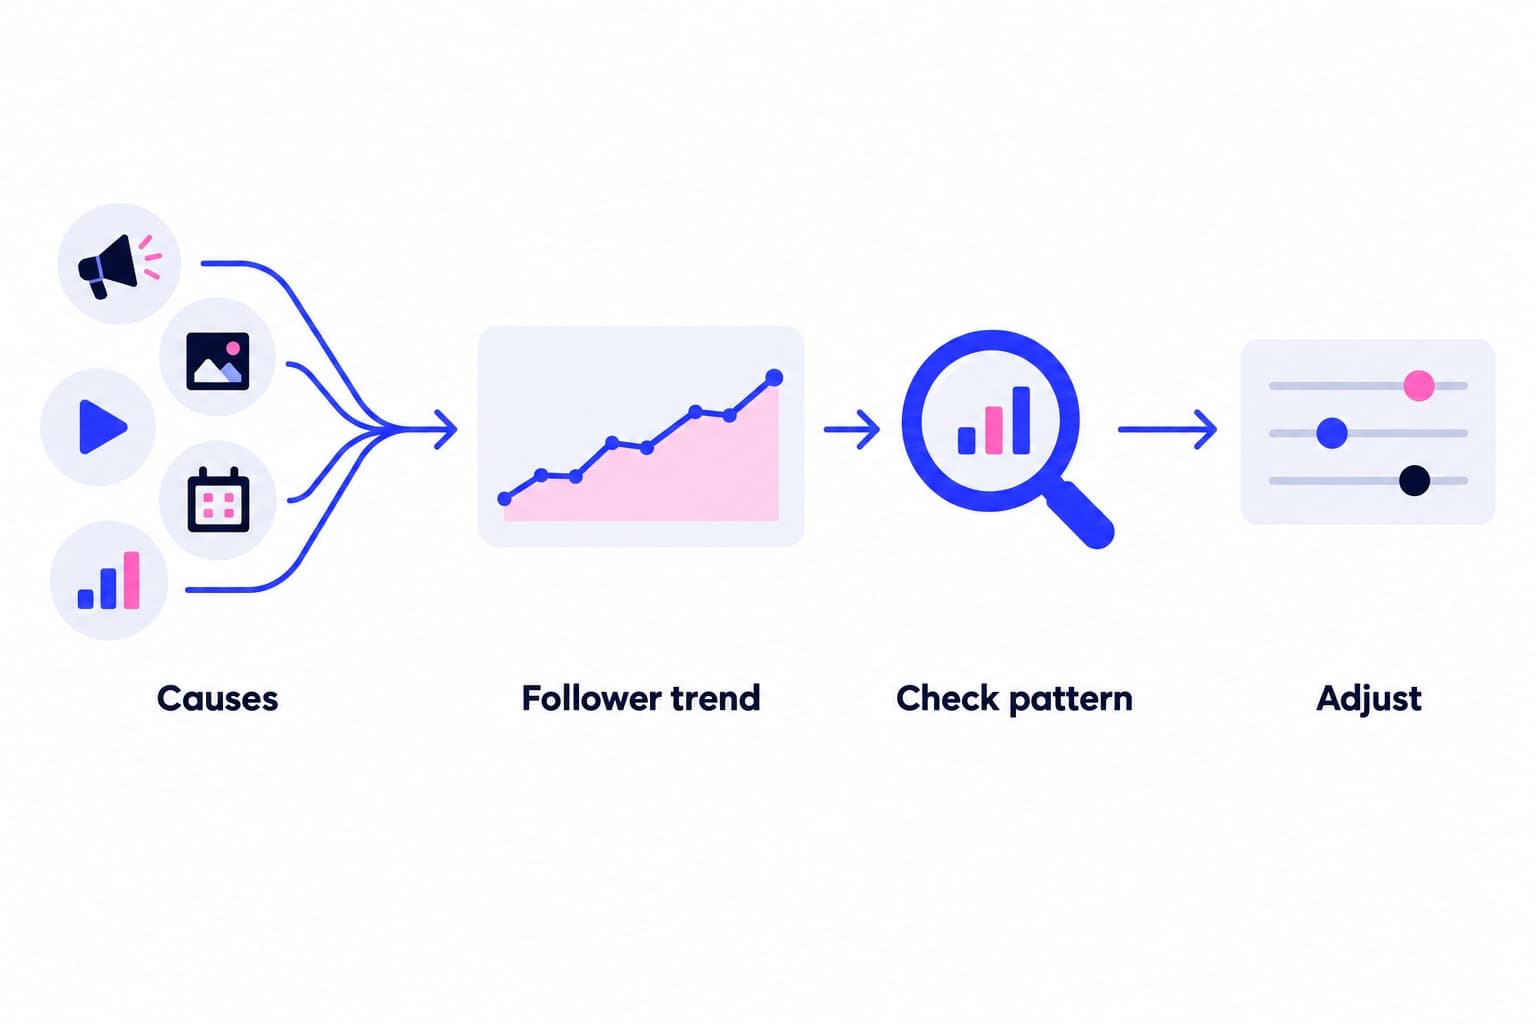
A falling percentage can coexist with more interactions. The denominator explains why.
Imagine the repair shop grows from 8,000 to 10,000 followers while average likes plus comments rise from 240 to 270. Its rate moves from 3% to 2.7%, even though each post now earns 30 more responses.
That's why I'd keep three figures together: follower count, average interactions per post, and engagement rate. Add profile activity when you're evaluating business results. Crossing into another follower tier changes the reference point, not the performance of posts you've already published.
For consistent discovery alongside your publishing, Ganicly's monthly Instagram growth plans promote your public profile to a targeted audience at a steady daily pace, starting from the smallest monthly plan. Keep publishing for that audience and track the absolute response as well as the percentage.
Pick a pace
Questions
Is 10% a good engagement rate on Instagram?
Yes, 10% is excellent compared with the follower-based creator medians here, which range from 0.6% to 2.6%. For a comparable result, calculate average likes plus comments per image or carousel, divided by followers. A 10% rate calculated against viewers answers a different question and belongs beside other viewer-based results.
Is 12% engagement on Instagram good?
Yes, 12% is exceptionally strong against these follower-based creator benchmarks. For a 5,000-follower account, that means averaging 600 likes plus comments per post. Check the arithmetic: 600 interactions spread across ten posts would average 60 per post, producing 1.2%, not 12%. Keep the post count in your calculation.
How do I increase my engagement rate on Instagram?
Start with a topic that already earns responses, then improve one element of the next comparable post. Make the opening image more specific, explain something useful, or ask a question people can answer from experience. Test timing with audience activity insights, and compare posts at similar ages using the same interaction definition.
What is the average engagement rate on Instagram?
There isn't one average that describes every Instagram account. The creator medians used here are 2.6%, 1.2%, 1.1%, 0.7%, and 0.6% across increasing follower tiers. A median is the midpoint of measured results, not an arithmetic average. Choose the reference that matches your account size, content format, and calculation.
How do I calculate my Instagram engagement rate?
For this article's benchmark, divide average likes plus comments per post by your follower count, then multiply by 100. First total those interactions across your selected images and carousels and divide by the number of posts. Record the follower count and sampling dates so your next calculation uses the same method.
Should I calculate engagement rate by followers or reach?
Use followers to compare with the creator tier medians in this article, and reach or unique viewers to evaluate response relative to exposure. Those denominators answer different questions. Label both the denominator and included actions in your report, and remember that interactions count actions while Accounts engaged counts unique participating accounts.